Introducing 400RGB: An Exploration of Color and Form
October 08, 2016

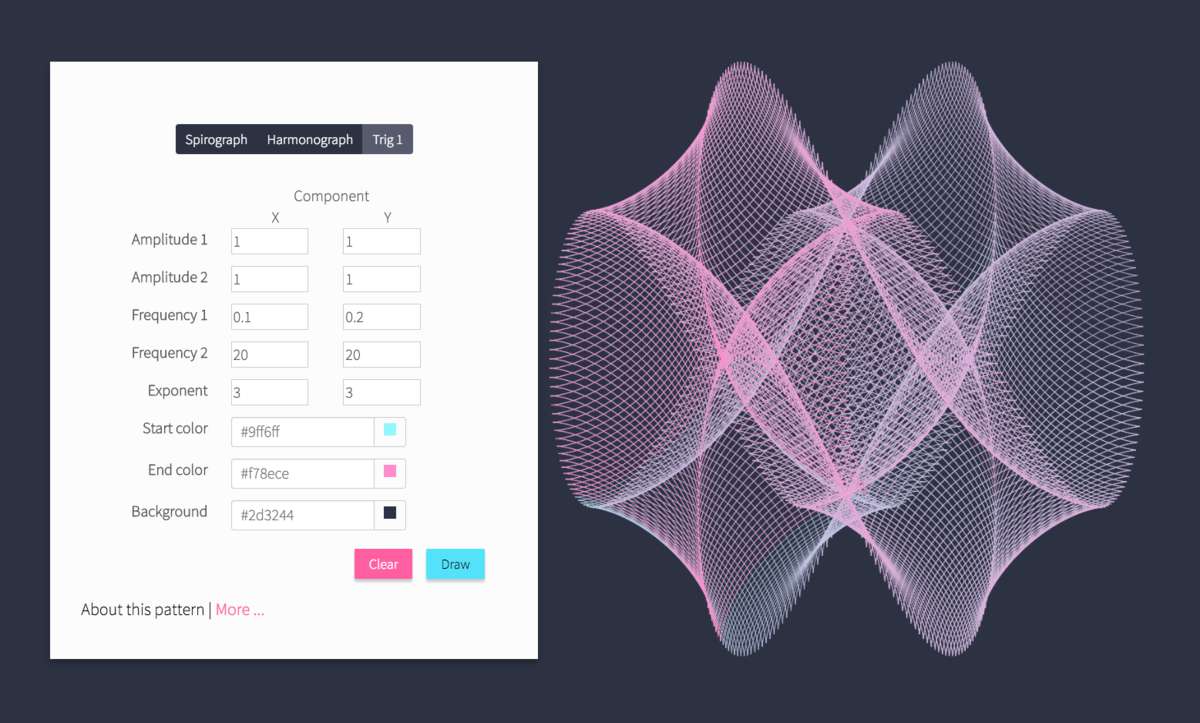
For some time I was thinking about working on a small piece, either digital or physical, that explores geometric shapes and vibrant colors. Recently the idea came together. I decided to use continuously varying colors and parametric curves - shapes that can be defined using math equations, to make some interesting patterns. To give this idea a structure, I decided to limit the number of colors and curves to 400. That’s how the 400RGB project started. This blog post summarizes the idea and its implementation in a web-app.
Basic Idea
There are a lot of folks who have used geometric shapes in painting. One artist that I particularly like is Frank Stella. Many of is earlier paintings consist of repeating curves with different colors. I used to think, maybe I can make something like that in Matlab. The last year, I came across the works of Clayton Shonkwiler, who uses vibrant colors together with beautifully transforming curves to create a sort of math-art. At the same time, I was exploring ideas about using simulated X-ray diffraction patterns and colors to create 3D patterns. Eventually, I had an idea - How about if I use a limited number of parametric curves and colors to and see what interesting patterns I can get?
I started off in Matlab and tried a couple of typical parametric patterns - spirograph, harmonograph, ellipses etc. I liked the idea and I created a gallery of twenty or so patterns. But I found that doing it in Matlab is kind of boring. So I started thinking if I can make a web-based app to do this.
Web App
I knew that the effort in terms of programming the parametric curve equations wasn’t going to be too much. But I wasn’t sure about the user interface. Eventually I decided to go for a Javascript-jQuery-Bootstrap front-end. And there we have it - a web-app for the project. The name of the project - 400RGB, just emphasizes that I am using a limited number of curves (400) along with colors.
This was a cool weekend project. Another one in the web-app series that I started last year.
- design
- web-dev